Exploring the Airbnb 2024 market in Hawaii
![Kauaʻi - Photo by Braden Jarvis on Unsplash[^1]](/assets/img/hawaiipost1.jpg)
In this report, I will explore an Airbnb listings dataset to understand the short-term homestays market in Hawaii. To achieve this, I will apply a set of descriptive statistics and communicate my findings with data visualisations.
Recently, Hawaii has caught my attention and become my number one place to visit for a lifetime adventure, which I am yet to fulfil. As a 90s kid, I learned about Hawaii from the animated Disney movie Lilo & Stitch, released in 2002. However, back then, it only seemed like a fictional place because it looked too good to be true.
Well, yes, Hawaii is a tropical state island consisting of 137 smaller volcanic islands in the middle of the Pacific Ocean. It has a beautiful coastline and enormous volcanic mountains, and one of them, Mauna Kea, is taller than Mount Everest (if measured from the base). I may have already sparked your interest in Hawaii a little bit, but just before I move on, here are some extra number facts:
• As of 2024, Hawaii’s population is estimated at around 1,446,146[^2]
• As of 2023, their median household income is $98,317[^2]
• They have the 4th longest ocean coastline in the U.S., measuring around 1,210 kilometres (750 miles)[^3]
Objectives
Now, let’s dive into my dataset exploration, where I will be looking at different areas of Hawaii, property types, reviews and prices. The purpose of this is to understand the short-term lettings accommodation market and draw some conclusions which will help to plan my trip. Here are some points I am going to cover:
• Neighbourhoods per island diagram
• Number of listings per island part
• Property type popularity
• Price range (min and max) per island part
• Map of listings
• Which property type is more likely to have 2 bathrooms per 2 bedrooms (when two couples want to share an apartment but want to have two separate bathrooms)
• Does a higher price correlate with a higher rating
The Dataset
The dataset contains listing details obtained from web scraping on the Airbnb website dated 12th December 2024.
| columns | 75 |
| rows | 35,493 |
Key information in the dataset includes:
• host details, e.g. name, host since date
• host performance/stats, e.g. total listings, response rate
• property details, e.g. bedrooms, bathrooms, price
• location data, e.g. latitude, longitude, area
• review scores, e.g. number of reviews, review scores
Data Transformation
Using the Power Query Editor in Power BI, I prepared my dataset by applying the following steps:
- Remove unnecessary columns
a. Remove all URL columns
b. Description (long strings) - Handle missing values
- Convert the data type of the price column to numeric
- Split the bathrooms_text column into two to separate the numeric values from a string
- Add an index column

Analysis
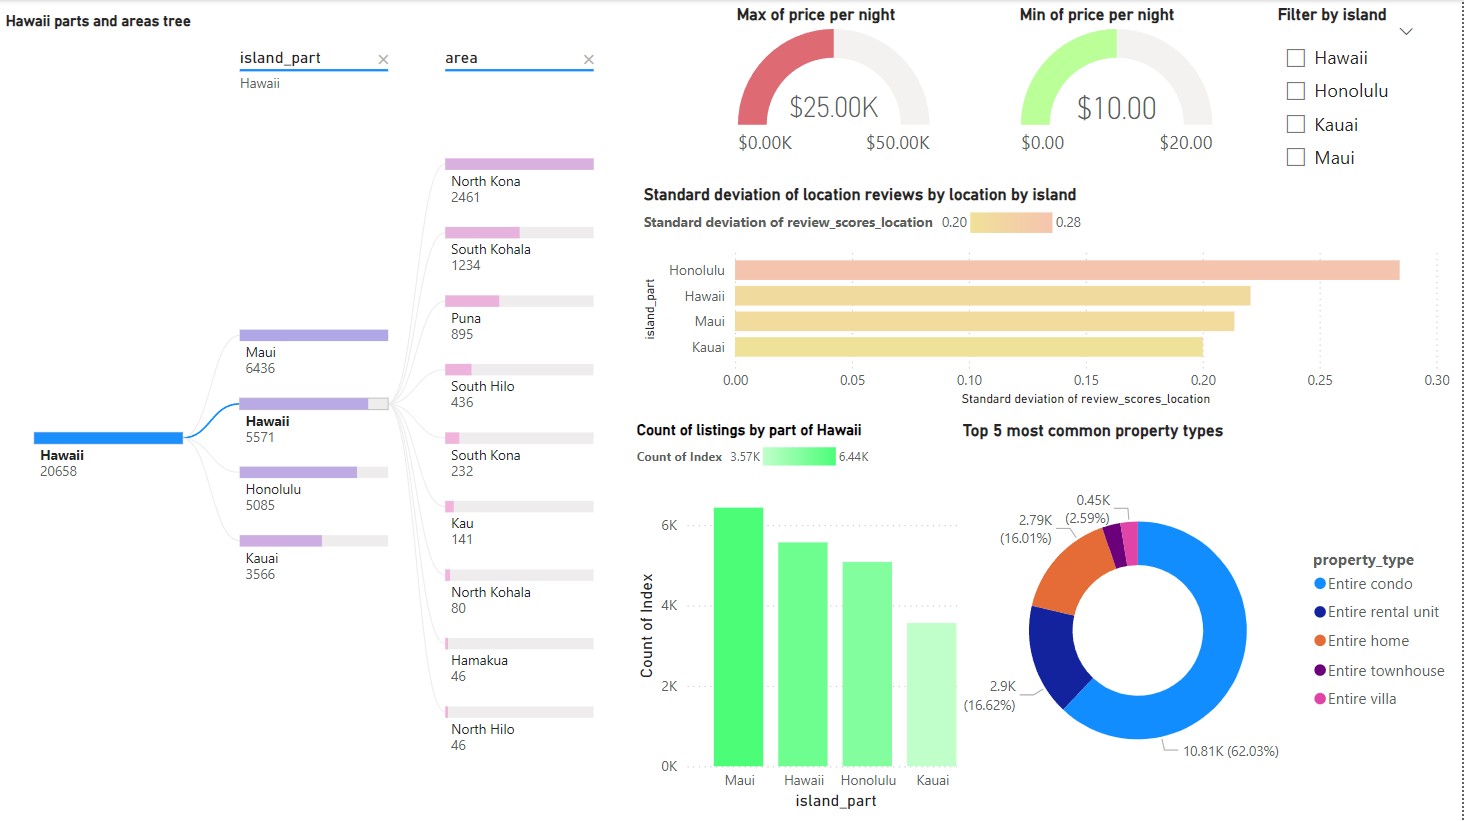
This analysis is broken down into two interactive dashboards, but I will focus on each data visualisation one by one to demonstrate what I’ve done. Because I fancy patterns and structures, I started with a decomposition tree to learn about the listing location levels.
Areas per island diagram
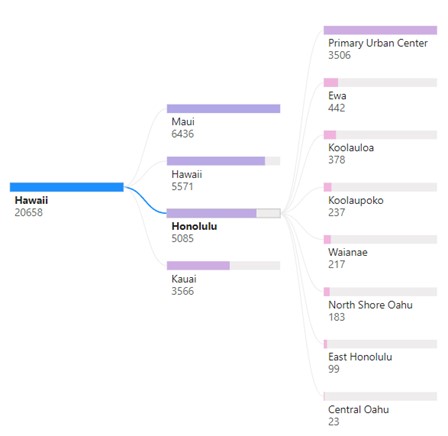
The chart illustrates the hierarchy of Hawaii’s areas by classifying them into levels, as well as groups and subgroups. What’s particularly useful about this chart is that you can easily switch between the areas of interest and use those areas as a slicer to dynamically change other charts and graphs within the dashboard.
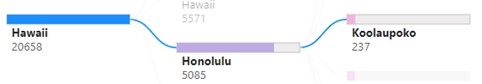
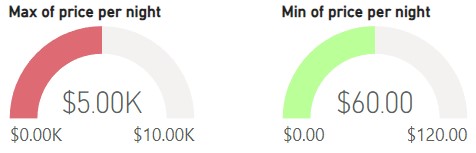
For instance, by selecting the Koolaupoko area in Honolulu, you can view the maximum and minimum price per night in this location on the price gauges.
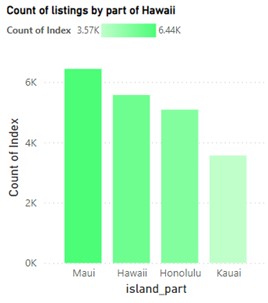
For those who wish to visit the island and check where you’ll have a greater choice of accommodation, this bar chart summarises all the listings by island part.
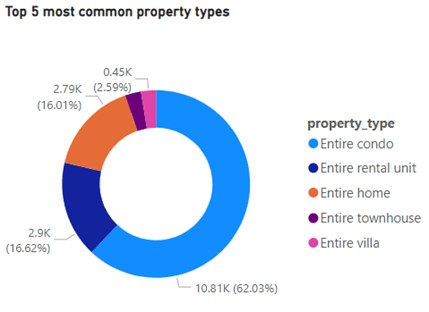
To take a step further and explore my accommodation choices, this pie chart shows the top 5 available property types. If you’d like to know what the price range of your favourite property type is, simply click on the relevant slice and watch the price gauges change.
Dashboard 1
Dashboard 2

I hope you found this exploration insightful. Please let me know what you think in the comments, and feel free to share any ideas on what else I could do in this analysis to derive even more interesting facts. Thanks 😊
Reference
Dataset source:https://insideairbnb.com/get-the-data\
[^1] Kauaʻi - Photo by Braden Jarvis on Unsplash https://unsplash.com/@jarvisphoto
[^2] U.S. Census Bureau: https://www.census.gov/quickfacts/fact/table/HI/PST045224\